The carbon footprint of a home

The first question in our carbon footprint calculator is “Where do you live?”. This is important to know because you are (most likely) connected to the electricity network in your home area, and it also gives us a range of alternative energy sources for heating/cooling. 

If you know your energy consumption in kWh (or other unit), and the source of your energy, you can calculate the exact impact on the climate by looking up the emission factor. But as this varies from country to country, we use average values in the calculator to give you a good estimation of what the carbon footprint is.

What do we use the energy for?

In our homes, there is usually some kind of heating, through radiators (the values from eurostat can differ if you live in a warmer climate and use more cooling!) Heating can come from electricity, but the variation is wide. In Sweden and Finland, district heating is very common. In other countries, natural gas is more prominent. If you live in a rental, you may not even know what the source of the heating is, and your possibility to change it may unfortunately also be limited. If you own your home, making a decision on changing your heating can be a big investment, but the impact you can have is big too. In the US, the best option for the climate is to electrify – and use green electricity. Regardless of where you are, you want to move away from fossil fuels. Remember, natural gas is also a fossil fuel!

Water heating can be done with electricity, gas or other energy sources. The most climate friendly way is to electrify – and use green energy!

Generally, in our homes we use electricity for appliances such as the stove and fridge, the microwave, the washing machine, lighting, the tv, computer, etc. Exactly what we use it for obviously varies from home to home. The electricity bill tells us which company supplies our energy and through them we can find out what the source of the electricity is. Today, many suppliers offer electricity plans from renewable energy sources. This can be a tiny bit more expensive, but it makes a massive difference on your carbon footprint!

What is the climate impact?

“Regular” energy in the EU emits 295,8 g CO2 per kWh, in the US it is 452,8 g. However, renewable energy emits only 10-20 g CO2 per kWh, depending on the source.

A 3-4 bedroom home in the UK uses on average 3100 kWh of electricity per year. If the source is regular grid electricity, the CO2 emissions are 723 kg. If renewable energy is used, the emissions are only 47 kg!

If you also heat your home with electricity and can switch your electricity plan from regular to renewable energy, you can reduce the carbon footprint from 2 tonnes to 100 kg (based on average values in our calculator). That’s amazing!

Of course it is great to always turn off appliances, and be mindful about how we consume energy in our homes. The greenest (and cheapest) kWh is the one we don’t spend! But to make the most impact possible, focus should be on the changes that make a big difference, not on a lot of small actions that have low impact. It is better to hang-dry your clothes than using the tumble dryer, but if you leave your phone charger plugged in it really won’t make a big difference. 

To do’s:

  • Switch to green electricity
  • If possible, electrify your heating or check what other renewable energy sources are available where you live (geothermal energy?)
  • Electrify your water boiler!

Wild cards:

  • Consider putting solar cells on your roof
  • Insulate the house
  • Get an air-pump (reduces energy consumption)

Curious to know more about your carbon footprint? Read the other posts in this series:

Me and my carbon footprint
What is a “carbon footprint”?
The carbon footprint of a home
The carbon footprint of a diet
The carbon footprint of our traveling
The carbon footprint of long distance traveling
The carbon footprint of shopping
The carbon footprint of public consumption

Or go to www.goclimate.com to calculate your carbon footprint now!
What is a “carbon footprint”?

What equals one kilo of CO2? Is a tonne of CO2 a lot? And how do our personal lifestyle choices affect how much is released into the atmosphere? This can all be hard to grasp because we can’t really see or touch the emissions. Below, we have listed some examples of how much CO2 is linked to different objects, what the impact is and info we hope will serve as a helpful tool to get this under control.

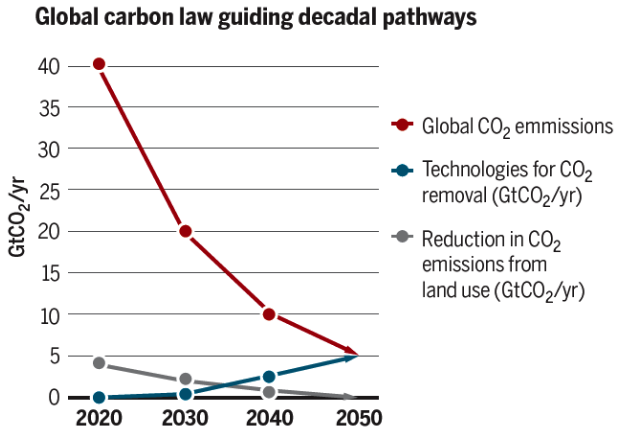
[Reminder] Globally, we emit about 40 gigatonnes of CO2 into the atmosphere each year. That number is so large that It feels impossible to understand. The info you may want to keep in mind going forward though, is that we need to reduce this number in half every decade to stay reasonably safe from climate change. That means, in 2030 we need to be down to 20 gt, in 2040 to 10 gt, and in 2050 to 5 gt.

Rockström, Gaffney, Rogelj, Meinshausen, Nakicenovic, Schellnhuber. Science 24 March 2017

The mindset to continuously half the emissions can and should be applied universally – by everyone. That includes governments, companies as well as us as individuals. It might seem like a big stretch, but let’s start with the low hanging fruit to start making an impact today – and it will just get easier from there!

Step one is to measure your carbon footprint. Countries are obliged to do this with data continuously tracked and updated by the UNFCCC. Some companies are obliged by national legislation to report their carbon footprint, while others do it on a voluntary basis. Individuals are currently not held accountable for their emissions, but judging by how rapidly our community is growing there are a lot of like minded people out there, seeing that they too can make a change and help contribute to meeting the targets needed for our planet’s well being.

The individual CO2 emissions of someone living in a western country is roughly 10 tonnes CO2. In some places it’s a little less, in the US and Australia it’s usually significantly higher (we will explain why in future posts). But this is a good general number to go by – 10 tonnes. Now, to start your own climate journey – go to our start page and calculate your personal footprint!

The strongest indicator of carbon emissions for an individual, is income level. That means that if you make 40 000 USD per year in Sweden or in South Africa, your emissions are likely more similar than between two people living in the same country but on different ends of the income spectrum. We still focus on economically wealthier countries in our business, as most of the consumption takes place in western countries and we therefore need to assume more responsibility.

Which items have a low vs high footprint? 

Banana0,08 kg
Streaming Netflix for an hour0,056-0,114 kg
a PET bottle0,43 kg
120 g cheese burger2,5 kg
A pair of running shoes14 kg
Train London – Paris15 kg
New iPhone 1172 kg
Couch90 kg
Laptop 15 inch MacBook Pro356 kg
Flight Paris – New York1,1 tonnes
Average driving in the US5,4 tonnes per year
New conventional car7 tonnes
New electric car10 tonnes
New house50 tonnes
1 hectare (10 000 m2) of deforestation500 tonnes

Hopefully these examples will help you focus on what is important. Try following these guidelines:

  • The things that fall under 1 kg – don’t stress about it.
  • If it’s more than 1 kg and you do it regularly – be mindful about your habits.
  • Purchases around 100 kg – it is definitely worth looking for climate friendly alternatives. Could you possibly find it second hand?
  • 1 tonne – is this really necessary? If there is no way to avoid it, offset the impact.
  • More than 3 tonnes – this should only be things which you cannot live without.
  • More than 100 tonnes – Is there anything you can do about this, even something small? Then you probably should!

The impact of 1 tonne of CO2 released into the atmosphere is terrifyingly easy to measure – it melts 3 square meters of arctic ice. So the impact of an average swede’s lifestyle is causing the disappearance of 30 m2 of arctic sea ice every year – that’s the size of 2,5 parking lots. Now let’s do something about that!

Curious to know more about your carbon footprint? Read the other posts in this series:

Me and my carbon footprint
What is a “carbon footprint”?
The carbon footprint of a home
The carbon footprint of a diet
The carbon footprint of our traveling
The carbon footprint of long distance traveling
The carbon footprint of shopping
The carbon footprint of public consumption

Or go to www.goclimate.com to calculate your carbon footprint now!

Me and my carbon footprint

We at GoClimate are striving to help people understand their carbon footprint. This is step one in our series of making it easy to grasp what your own emissions stem from and how to handle them!

A lot of the things we do emit carbon dioxide (and other Greenhouse Gases) into the air, directly or indirectly. Big corporations are responsible for a large share of emissions through production of fuels and different products, and governments are responsible for national policies and collective emissions. But as individuals, we are also responsible for a share in all of this through our lifestyle choices and consumption. That’s why we need to come together in order to change this, and create a better way of living that doesn’t harm the climate.

Global emissions – who is responsible?

Globally, we humans emit about 40 gigatonnes of CO2 into the atmosphere each year. That number is so large that It feels impossible to understand. If we break it down by country, we need to remember that some countries, like China and Saudi Arabia, have high emissions because they produce goods that are being consumed in other countries. Usually the national emissions are presented based on the production, not the consumption, of goods. Measuring the consumption is more difficult, but perhaps more important if we are interested in responsibility.

In terms of production, Sweden emits something like 42 million tonnes of CO2 per year, or 4,25 tonnes per capita (our world in data 2017). However, when we look at consumption, we are responsible for 9,87 tonnes per capita (Naturvårdsverket 2017) – more than twice as much! We use Sweden as an example here, because not all countries report data for consumption based emissions. To make sure that we take responsibility for what we can, as individuals we need to focus on the consumption-based emissions.

How should we handle this?

It would be so great if all governments came together and established (and implemented!) legislation which prevented the emissions of CO2 which destabilize our climate. But right now, they are not, and this problem is too urgent for us to accept inaction. If we all join forces, we can both reduce emissions on an individual and collective level, as well as exert pressure on governments to improve legislation. This is not an either/or situation, we need to do everything!

We at GoClimate have developed our carbon footprint calculator as a first step in understanding the carbon footprint of an individual. It is a simple calculator based on average values, which is enough to give you an overview of what you are currently doing to contribute to climate change, and focus on what the main areas are where you can reduce your emissions.

How does each person cause emissions?

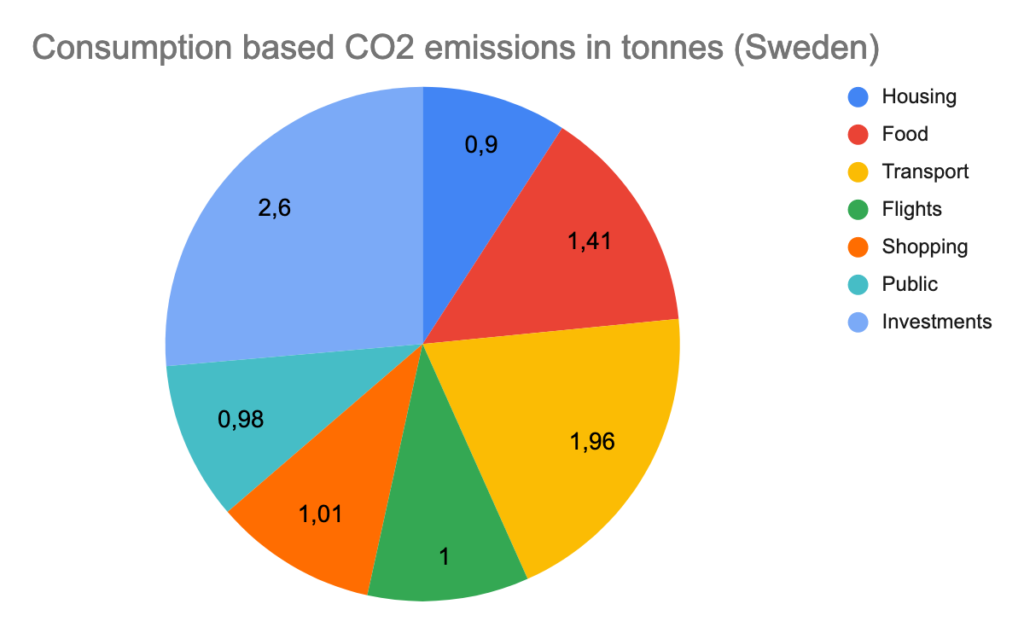
As mentioned above, an average Swede emits 9,87 tonnes per year. Transport is the cause of 1,96 tonnes, adding to that international flights of 1 tonne, food is 1,41 tonnes, private consumption (“shopping”) is 1,01 tonnes and housing is 0,9 tonnes. Adding to that public consumption and investments, 0,98 and 2,6 tonnes respectively. This indicates that there is a large part that is hard to reduce on your own, and that we also need to push politicians to make the right decisions to get this under control. But the larger share is ours to handle! Empowering, right!?

Curious to know more about your carbon footprint? Read the other posts in this series:

Me and my carbon footprint
What is a “carbon footprint”?
The carbon footprint of a home
The carbon footprint of a diet
The carbon footprint of our traveling
The carbon footprint of long distance traveling
The carbon footprint of shopping
The carbon footprint of public consumption

Or go to www.goclimate.com to calculate your carbon footprint now!

Switching to an electric car without breaking the bank

Note: This is a personal story from team member Stefan

I just recently moved out of the city and to a town in the mountains of Sweden. Having always before been able to use public transportation, I found myself in a place where I now need a car to get around, while also being fully out of reach of any car sharing services. This is my story of researching reasonably priced alternatives for getting a car with the least possible climate footprint.

If you are able to use car sharing services or public transportation, you should always consider not owning a car at all. If not, read on to learn a few surprising facts that make getting a brand new electric car more reasonable than you’d think.

Note – make sure to top up your car with green electricity!

Requirements and options

I knew from the outset that the long-term goal was to get an electric car. I just didn’t know if our fincancial situation would support this right away. My partner and I make good money, but not by any means enough that we can afford to freely just lease or buy any car. We do, however, have the ability to increase our loans at a reasonable interest rate to be able to pay for a new car, provided that the purchase doesn’t turn into the money sink that new car purchases traditionally are.


We are looking for a car that works for typical usage. We’ll be driving both short distances and long. It’s going to be our only car. So what we end up with has to:

  • Have range enough to be workable on long journeys.
  • Be big enough that we can bring outdoors gear like skis and big backpacks on trips.

Getting into specifics, I looked into three categories of cars to consider:

  • Fully electric cars, new from dealerships.
  • Plug-in hybrid cars, second hand.
  • For comparison and as a last resort, lower priced regular gasoline cars, second hand.

The reason that second hand fully electric cars are not on this is that they’re very close in price to brand new cars (more on that later), and by going for a new car we would have the ability to get a tow bar that we can mount a bike rack on. If you don’t need a tow bar, there is a (small) market of second hand fully electric cars with long range (350 km/220 miles or longer). If you’re able to get one of those, you can make the financials for electric cars later in this post even better.

Go for a long drive without emissions

Plug-in hybrid cars

My initial thought was that plug-in hybrid cars would be the most reasonable option while waiting for fully electric cars to come down in price. But after looking into it, two factors make them less attractive than one would think.

First, if you regularly drive longer than the battery lasts (usually around 30-40 km/20-25 miles), you end up with a very thirsty car. Most plug-in hybrids are very heavy cars and have fuel consumption upwards of 10 l/100 km (as low as 25 mpg) after the battery depletes. For all but the very shortest trips, this defeats the fuel savings of having a battery.

Second, these cars are basically two cars in one that both need maintenance. In terms of maintenance cost, they are are, if anything, more expensive to keep running than even traditional combustion cars.

If you’re able to charge at home, drive almost exclusively within the short battery range and are strictly limited in purchase price, then maybe a plug-in hybrid car be a good option. Otherwise, I have a hard time justifying them as a way to reduce one’s carbon footprint. For us, getting an efficient combustion or non-plug-in hybrid car, would actually have been a better choice.

Brand new electric cars

Fully electric cars used to be crazy expensive, but this is fast changing. For sale right now with 350 km/220 miles of range or more in the most affordable price range are three models: the Kia e-Soul, Kia e-Niro, and Hyundai Kona Electric. Available for order this year and with delivery dates within a year you’ll also find the Volkswagen ID.3 and Skoda Enyaq iV.

All of these sell for around €45,000 (in Europe), but a few insights helped me realize this relatively high price isn’t as bad as it seems:

  • Many countries have government grants when buying new electric cars. In Sweden, the grant is about €5,800.
  • Maintenance, vehicle/road taxes, and, most strikingly, driving costs are way lower for electric cars.
  • Value depreciation is, as mentioned earlier, not at all as bad as with non-electric cars, especially when taking government grants into account. For the models I looked at, one year old cars with above average milage were selling for just around €5,000 – €7,000 lower than the brand new price after grants. This reasonably gets much better (on a monthly basis) if you keep the car for 2 or 3 years, but there are no numbers for that as all these models initially went for sale just last year.

The numbers

So let’s look at the numbers. All figures are yearly costs in Sweden converted to Euros. I’ve used the best sources I could find, trying to find actual maintenance costs from current owners and quoting insurance for these models for myself.

New Hyundai Kona ElectricSecond hand Mitsubishi Outlander PHEV (2017)Second hand Opel Astra (2015)
Maintenance€210€500€500
Vehicle/road tax€35€35€135
Insurance€350€650€350
Electricity1 3€380€3502
Fuel1€4052€1,360
Total€975€1,940€2,345
  1. Using the average yearly milage in Sweden of 15,000 km per year.
  2. These calculations assume 50% usage on battery for the plug-in hybrid.
  3. Electricity costs of 0.2 Euros/kWh.

At this point, before financing, we’re looking at a monthly cost of €81 for the fully electric car, as compared to €161 for the plug-in hybrid and €195 for the combustion car.

So you’ll have €114/month extra to put towards financing of the more expensive electric car. Even though this is better than one might think already, chances are that the €114 won’t be enough regardless of how you choose to finance the car. Which brings me to…

How to make the car free

More and more people want to drive electric and more and more people are looking to car sharing services to replace car ownership. So for those of us who have to own a car, let’s contribute to the other side of that equation and make our cars available for others to rent. Renters will look to the cheap-to-drive and climate friendly electric cars, and owners of those cars can use that income to bridge the cost gap compared to traditional cars.

Sharing is caring – also for the climate

Looking at the two big options available in Sweden, Snappcar and GoMore (also available in a number of other European countries), you can expect around €300-400/month for renting your car a few times each month. Together with the €100+/month you’re saving in driving costs, you’re now looking at upwards of €500/month in combined savings and income that can be put towards financing of the car. This sealed the deal for us, because depending on how much we rent the car out, we actually have a decent chance of having the car pay for itself entirely.

On top of that, we’re now helping others reduce their carbon footprints in addition to reducing our own.

Making the change to green electricity!

Is it finally time to swap to green electricity? This is how much of a difference it will make!

Swapping your standard electricity plan for a green one is perhaps the most impactful one-time action you can take to reduce your personal carbon footprint. This post explains why and how to do so with tips specifically for the UK, the US and Sweden, but the principles are the same pretty much everywhere.

Before we start – green energy is often disclosed as having zero emissions, but in this post and generally throughout our calculations, we assume 15 g CO2e per kWh to account for maintenance and grid operations – just to be on the safe side.

We all use electricity at home, let’s make it green!

UNITED KINGDOM

Average electricity consumption in the UK for a 1 or 2 bedroom house/flat is 2,000 kWh, for a 3 or 4 bedroom house 3,100 kWh and for a 5+ bedroom house it’s 4,600 kWh. This considers only general electricity use, and not gas consumption for heating and hot water. Using “regular” electricity in the UK which has an emission factor of 255,6 g CO2e per kWh, this result in CO2 footprints of:
511 kg CO2e for a 1 or 2 bedroom house/flat,
792 kg CO2e for a 3 or 4 bedroom house and
1176 kg CO2e for a 5+ bedroom house.

Comparing that to renewable energy, the CO2 footprints would instead be
30 kg CO2e for a 1 or 2 bedroom house/flat,
46,5 kg CO2e for a 3 or 4 bedroom house and
69 kg CO2e for a 5+ bedroom house. That’s amazing!

The market for green energy in the UK is similar to that of Sweden. The big companies often offer green plans, but there are also smaller suppliers which can give even better packages and other added benefits. Since homeowners in the UK often have electricity and gas from the same provider, it is worth considering the overall benefits of also changing to a supplier that offers green(er) gas.

T3.com is one of the the UK’s leading consumer lifestyle websites, and they have an up-to-date guide on the best green energy suppliers, as well as a guide on how to switch and a price comparison. Check out the suppliers HERE

In the EU, according to the Directive 2003/54/EC, electricity providers have to disclose source of the electricity (how it is produced), and the environmental impact, at least the CO2 emissions and nuclear waste. So you as a consumer can feel confident that you know the difference between the options!

USA

The average household in the US consumes 10.972 kWh annually, noting that there is great variability between states. Given that the average emission factor for electricity in the US is 456 g CO2 per kWh (again, with great variability between states), this standard home is responsible for emitting 4998 kg of CO2 per year! That’s almost five tonnes! Changing electricity provider to a green energy plan can make a huge difference here, and if you want to reduce your carbon footprint this action probably has the highest return on effort invested.

How? The first step is to check if your current provider offers a renewable/green energy plan that you could transfer to. Some power companies supply this as an alternative, it’s often referred to as “green pricing”.

If you want to change provider, you’ll have to find one that supplies green electricity in your area. The Center for Resource Solutions offers a database for Green-e certified renewable energy. Search for “Residential Renewable Energy”, you can also filter the results by state. Another alternative is CleanChoice Energy, also available in several states. If that doesn’t give you any good options, try a google search for your state/city and renewable energy providers.

Given the structure of the energy market in the US, not everyone can actually choose their energy provider (it depends on the state regulations). If you are still willing to go the extra mile for green electricity, you can purchase green certificates or “Renewable Energy Certificates” (REC). This means that you pay the price difference between the market price for regular electricity and the price for producing green/renewable energy, and you therefore contribute to financing sustainable energy even if you can’t have it served in your own home. The Green-e database allows you to search for “Residential Renewable Energy Certificate”, and if you can’t find anything there – Google is your friend.

Again, given the massive difference it can have on your carbon footprint, it is worth investing some time in! Especially given that once you’ve made the switch, you don’t have to do anything else!

Sidrap Wind Energy Park in Indonesia
We support a renewable energy project in Indonesia, but what about buying renewable energy at home too?

SWEDEN

In Sweden, an apartment uses on average 2000 kWh of electricity per year, and a house uses 6000 kWh for general electricity use. For heating and hot water, an apartment uses on average 10000 kWh and a house uses on average 15000 kWh.

For “regular” energy, the CO2 emissions per kWh is 338,52 g. This means that for general electricity use, an apartment causes emissions of 677 kg CO2 and a house 2031 kg CO2. If the home is also heated with electricity, the apartment causes emissions of 4062 kg and the house 7109 kg.

For green energy, the emission factor varies depending on the source, but a safe value to use is 15 g of CO2 per kWh. This means that for general electricity use, an apartment causes emissions of 30 kg CO2 and a house 90 kg CO2. If the home is also heated with electricity, the apartment causes emissions of 180 kg and the house 315 kg. This is a massive difference! The price difference is less than 10%. What are you waiting for?

How to move ahead: First check which provider you currently have. This is specified on your electricity bill (paper or digital), or you can check where the money goes on your bank statement. If you want to stay with the same provider, see if they have a green electricity option. Otherwise, you can do a Google search and see if you find a provider that is more appealing – either with price or with other factors, like sustainability. There are services like https://www.elskling.se/ where you can compare prices and filter for green electricity.

This is perhaps the easiest step to make a significant difference to your carbon footprint. Let us now in the comments if you’ve made the change and what tips you have for others!

Want to offset your entire carbon emissions? Calculate your carbon footprint and transition to a climate neutral life today!

5 climate tips to reduce your carbon footprint

We give you five relatively simple tips on what you can do to reduce your climate footprint.

1. Can you choose green electricity?  Check if your provider has a green electricity plan for you! Either on their website or by calling them. This can reduce your emissions significantly! In the EU, your electricity provider is obliged to let you know the energy source (referred to as electricity disclosure).

2. Cut the meat in favour of a more plant-based diet. This can reduce your diet’s footprint by 50%. For more info read our “Meat eater’s non-dogmatic guide to becoming more vegetarian” and “How to reduce your carbon footprint from food”. Find vegan and vegetarian food inspiration at Sweet Green Vegan, Green Kitchen Stories, Plant-Based RD and A Vegan’s Paradise.

3. Skip the car – take the bike. In average an car in the US emits 5,4 tonnes a year while biking has no carbon footprint at all.

4. Take a free digital quick coursethe Climate Leader – to understand how you best take climate action.

5. Carbon offset your lifestyle with us and help accelerate the transition to renewable energy around the world.

How much do I need to reduce my climate footprint to contribute to the Paris Agreement and the important 1.5 degree goal?

According to the study 1.5 degree lifestyles (2018), globally, in the year 2030, we can emit maximally 2.5 tonnes CO2eq/person to have a chance of managing the decisive 1.5 degree target. In 2040, we will be able to emit maximally 1.4 tonnes CO2eq/person, and in 2050 – a maximum of only 0.7 tonnes CO2eq/person. Read more about this here.

Currently, the average American emits nearly 20 tonnes CO2eq per year.
Source: http://css.umich.edu/factsheets/us-environmental-footprint-factsheet

Climate tips to save the planet

What is the carbon footprint of the internet and streaming?

If you have spent more time online than usual lately – you are not alone! Especially streaming has had almost exponential growth, as our consumption patterns of movies and series has been revolutionized by online services. Have you ever wondered if all the hours on Netflix actually have a carbon footprint? We dig into the details!

Powering the internet uses a massive amount of energy, from the remote data centers all the way to the power of the device that you are reading this on. The scope of it makes it incredibly challenging to calculate, and even when we do, the numbers are almost too large to grasp – the carbon footprint of YouTube has been estimated to 10 000 000 tonnes CO2e. What can be said is that the internet is currently responsible for 2 percent of global carbon emissions, and this is because 80% of the energy used to run it comes from fossil fuels. This is basically the same amount as the emissions from the aviation sector! But let’s not forget, this also has to be put into perspective of the emissions that are avoided elsewhere – all the physical letters not sent thanks to emails and online bank services, just to give an example (although we all could probably reduce the number of emails we send and receive!).

All your screens are in dialogue with remote data centers. Photo by Domenico Loia

What is really booming on the internet right now is major streaming services. Almost 58% of downstream traffic on the internet is video, and Netflix alone held almost 20% of the traffic in the US in 2018 – a number that is probably not decreasing. So what is the carbon footprint of this?

Let’s start by saying that the carbon footprint of streaming is lower than driving to the cinema to watch a film there. This is not an argument to make people stop streaming, but to understand how our small actions add up to a big impact and that we should take responsibility – both for our own behavior, but also to encourage providers to do everything in their power to optimize operations.

A French think tank called the Shift Project first made some pretty horrifying calculations on this, estimating that watching 30 min of Netflix is equivalent to 1,6 kg of CO2 emissions. However, it seems like they based it on some wrong assumptions, as George Kamiya, Digital/Energy Analyst at the International Energy Association points out. According to his calculations and official IEA data, streaming a Netflix video in 2019 typically consumed 0.12-0.24kWh of electricity per hour, which is between 25 and 53 times less than the Shift Project estimation. So if we use the emission factor for the global average energy mix, that would give a carbon footprint of 0,028 – 0,057 kg (28 – 57 grams) CO2e for a 30 min Netflix session. Less than the carbon footprint of a banana!

So, it’s not actually that bad to watch Netflix (or, sending one email). However, we should consider how much traffic we generate, because it really does add up. Don’t leave things on in the background. If you listen to music, do so from a program that only gives you the music, and not the video stream (yeah, playing YouTube on another tab than the one you are watching is wasteful!). Pause videos that start just because you are scrolling on a page. Unsubscribe from all the newsletters that you don’t read anyway.

Do you need to use several devices at the same time?

But more importantly, we need to make better IT design. How can we optimize data transfers? Do we need to send as much as we do? It will be both faster, cheaper and better for the environment if we can implement sustainable interaction design! Researchers from Bristol University suggested that digital waste could be reduced if YouTube stopped playing the video when the window isn’t open – and that this could save up to 500 000 tonnes of CO2e per year! And streamlining solutions like this one could potentially be found anywhere, helping us all to keep emissions from digitalization under control.

Do you work in IT? Could you design better systems to slim down the quantities of data that are being sent across the internet? Exciting challenges ahead of you!

If you want to read even more, start HERE (medium article)

Methodology behind the carbon footprint calculator

There are different ways to calculate the carbon footprint of an individual. If you have tried out more than one calculator, you have probably noticed that the questions differ and so do the results. The quick answer to why this happens, is that it depends on which data the calculator is based off, and what assumptions are made. For the GoClimate calculator, we have explained the rationale between the choice of underlying data and the calculations that we base the tool on in the Methodology, which can be accessed HERE

If there is anything in the methodology that you find questionable, please reach out to us! Let us know if you disagree, have a better source of data for something, or how we could improve. The calculator will change over time because emission factors are updated regularly, which means that your result can change in the future. It could also change if we find better data or an even better way to calculate. These adjustments are however most likely minimal, and the biggest change is what you do yourself!

We calculate Food with general values from a UK study. Flights are calculated with our own API, and Car with emission factors provided by national sources (so that differs depending on where you are). Housing is using calculations based on national data on energy and electricity usage and national emission factors. Personal consumption, which is the clothes, furniture and other things you purchase, is based on a national average, weighted based on how much you purchase brand-new. To this we add a buffer for Public consumption which is infrastructure, hospitals, education etc.

Curious to know more about your carbon footprint? Read the other posts in this series:

Me and my carbon footprint
What is a “carbon footprint”?
The carbon footprint of a home
The carbon footprint of a diet
The carbon footprint of our traveling
The carbon footprint of long distance traveling
The carbon footprint of shopping
The carbon footprint of public consumption

Or go to www.goclimate.com to calculate your carbon footprint now!
Our team is growing and doing more good for the climate than ever before!

We have recently almost doubled the number of team members at GoClimate, with three new co-creators that allow us to proceed even faster and more efficiently towards our goal of creating a better tomorrow and a healthier planet.

Alexandra Palmquist is GoClimate’s climate advisor who came to us from the United Nations Development Programme in Bolivia, where she worked on climate and environmental projects. Previous positions include the European Commission in Belgium and the NGO We Effect, where Alexandra was stationed in Mozambique. Alexandra will work with measuring and reducing both individual and corporate climate impacts, and review of the climate projects we finance. Outside of work Alexandra recharges her energy by going running or dancing tango!

Tove Westling is the founder of the London-based PR agency VARG, which has worked with the establishment of brands such as Dagmar, DAY Birger et Mikkelsen, Filippa K, CDLP and Samsøe Samsøe on the British market. Tove has also been responsible for the agency’s focus on sustainability, and managed Vestiaire Collective’s PR in Scandinavia. With us, she works primarily with increasing climate commitment both locally in Scandinavia and globally. Beyond the climate issue, Tove’s heart is pounding for animal rights, above all with a commitment to stray dogs around the world.

Emma Bäckström is a trained civil engineer in media technology at KTH Royal Institute of Technology and has most recently worked as a developer at Mentimeter. At GoClimate, in addition to development, she also works with user experience and product development of our web service. In addition to saving the world, Emma wants to pet dogs and go running in the woods!

Besides the fact that we find it so exciting to have a living, growing team, we are extremely happy about what climate benefits this entails – as we can see that the number of co-creators is directly related to how much difference we make for the benefit of the climate. In 2017 we contributed to 660 avoided tonnes of CO2e per co-creator, in 2018 18, 000 avoided tonnes and in 2019 36,670 avoided tonnes per co-creator. We look forward to expanding the team further in 2020 and thus make even more positive difference!

How to reduce your carbon footprint: FOOD

how to reduce your cabron footprint

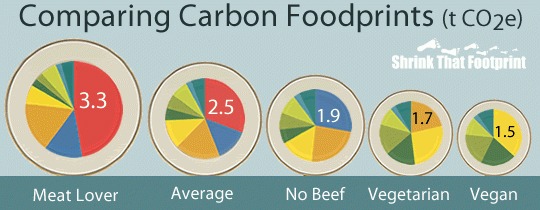
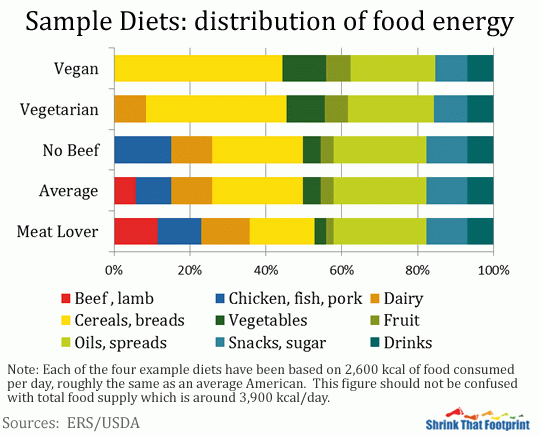
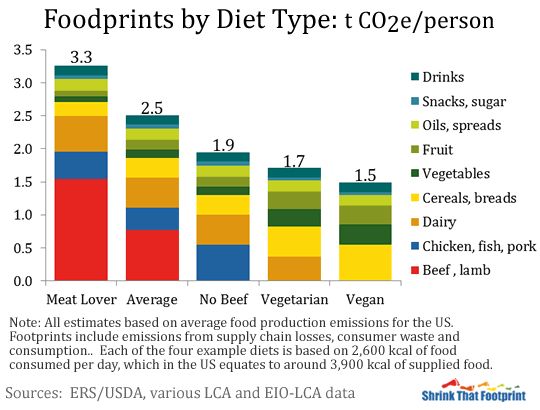
If you’ve already taken a carbon calculator test, you should know approximately what the emissions are for your diet. If not, here’s a list of different ways of eating and how big or small the carbon emissions are per person per year.


Diet

The charts above are very clear and it might not come as a surprise to many of you that a plant-based diet is more climate-friendly.

Now, I’m not going to push you all to become vegan. But I do hope you will try to eat fewer animal products and more plants. It’s better for your health, the animals and the planet.

Meat production has increased 4 times in the last 50 years. And in many countries, it is common to eat some sort of meat with every meal – breakfast, lunch, AND dinner.

UN experts say that to be able to eat meat in a sustainable way, we should rather aim for having meat for ONE meal a WEEK.

Cow and lamb meat are the worst when it comes to environmental impact and should be cut down dramatically to reduce your personal emissions.

But it’s so much bigger than just about the amount of CO2 it creates. It’s not even all about the greenhouse gases (cow farts release high quantities of methane gas, which is many times more potent than carbon dioxide).

The consumption of animal products is also the main cause of deforestation in the rainforest. One of the planet’s most vital “lungs”, which captures the CO2 to then release oxygen. So the animal agriculture both emits an immense amount of greenhouse gases and remove the natural machines that suck CO2 from the air. It’s a double negative that doesn’t become a positive.

Another part of animal agriculture that worries experts is the high usage of antibiotics, which increases the risk of bacterias building up a resistance to it.


Food Waste

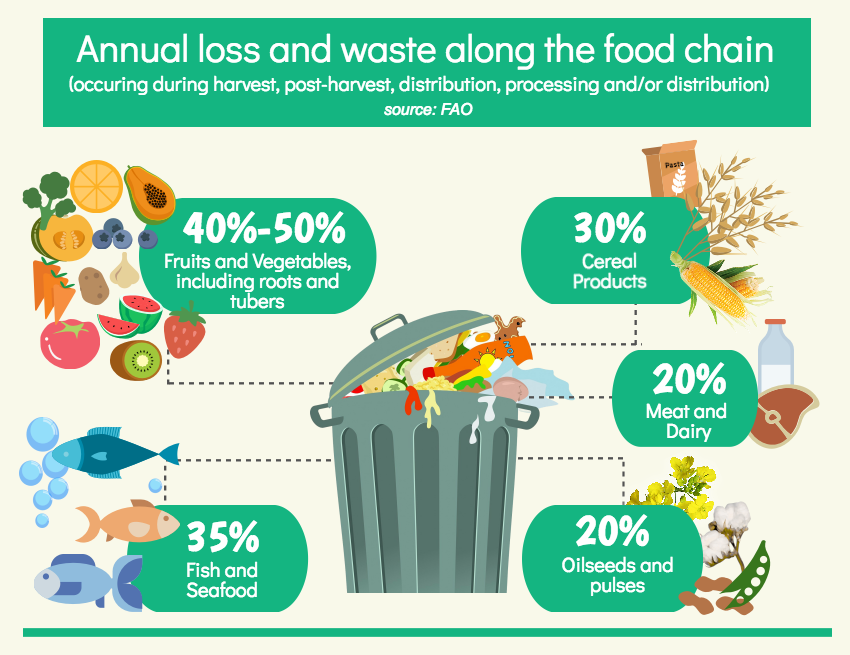
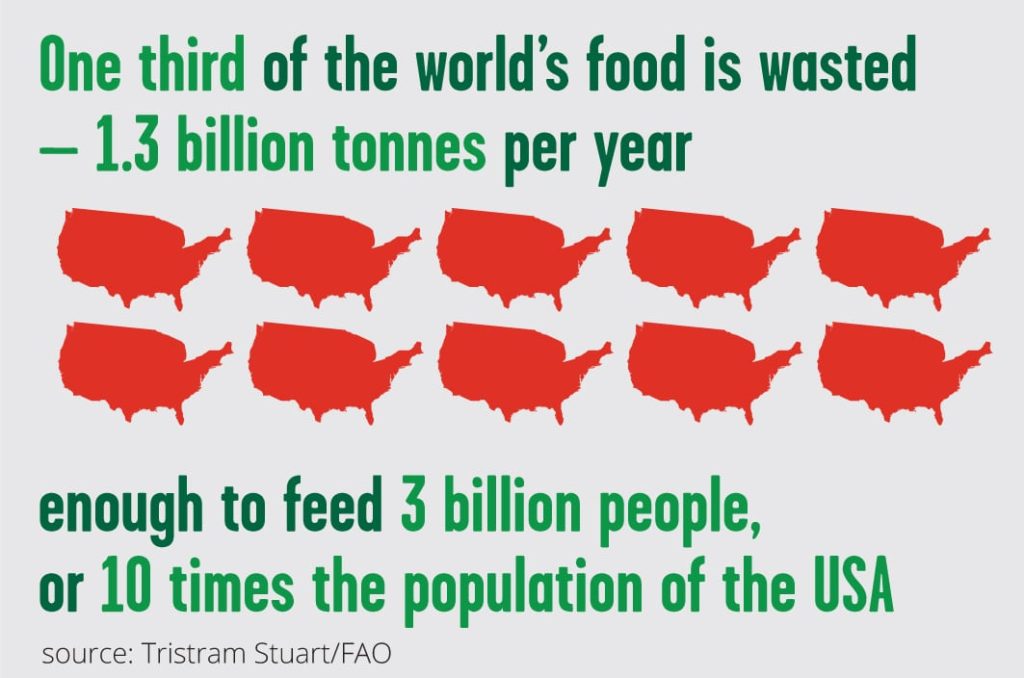
Did you know that 1/3 of all food that is produced for humans goes to waste? Tossing out edible food that took both resources like water, land use and creating greenhouse gases. Just imagine how much CO2 could be saved if we could stop food waste!

But of course, not all food waste happens in the home by us, the consumers. Edible food is first wasted when they don’t fit the aesthetic criteria (being too small, too big or too wonky). And then supermarkets sometimes order more food than they then accept, leaving literally tons of edible food going to waste before it even has a chance to be sold. And then as many of us are already aware of, many grocery stores throw away edible food to either make room for new items on the shelves. One broken egg makes the whole box being thrown away or when one of many vegetables or fruits in a pre-packaged bag is bad, they are all thrown away. Or perhaps it’s food related to holidays like Christmas or Easter that aren’t interesting for consumers after the holiday is over. It’s also common for products to be thrown away when it gets to close to “best before”-date even though the food will be good to eat long after that set date.

It’s calculated that in Sweden, the average worth of edible food thrown out each year per person is €400-600. Not only will minimizing your food waste save the planet, but it will save your wallet too. What would you do with an extra €400-600/year?


Location

Where your food was produced, packaged and shipped from also matters. Some food is flown in, others are shipped by cargo ships and others can be produced locally to where you live!

Try to opt for a diet with products that can and is being grown in the country where you live, or as close to it as possible.


Seasonally

If you opt for food that is in season, it’s both cheaper and there’s no need to grow it in energy-intensive greenhouses. Of course, eating seasonally and locally is the best, but it’s also worth keeping in mind that not all food that is shipped from overseas is in season from where it was grown either. So try to learn, or print a guide that shows you what food is in season when to make it easier for you to plan your meals accordingly.


How it is grown

In the hunt of creating genetically perfect crops and crops that aren’t attacked by any type of insects, the soil was left out of consideration. Monocrops and pesticides stripped the vital soils of nutrition and biodiversity, leaving it unable to

As Project Drawdown puts it:

“Conventional wisdom has long held that the world cannot be fed without chemicals and synthetic fertilizers. Evidence points to a new wisdom: The world cannot be fed unless the soil is fed.”

And this is where Regenerative Agriculture comes in.

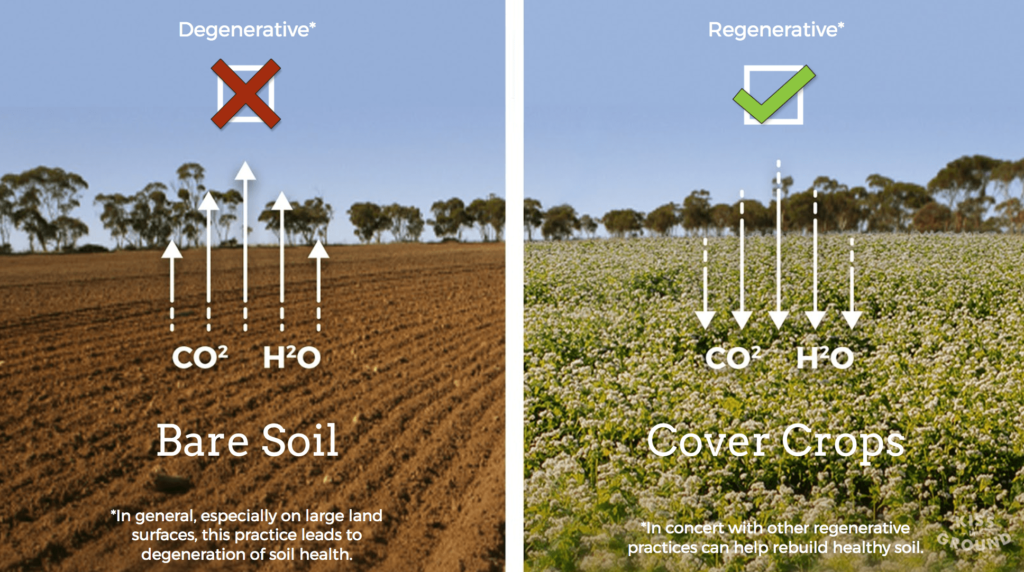
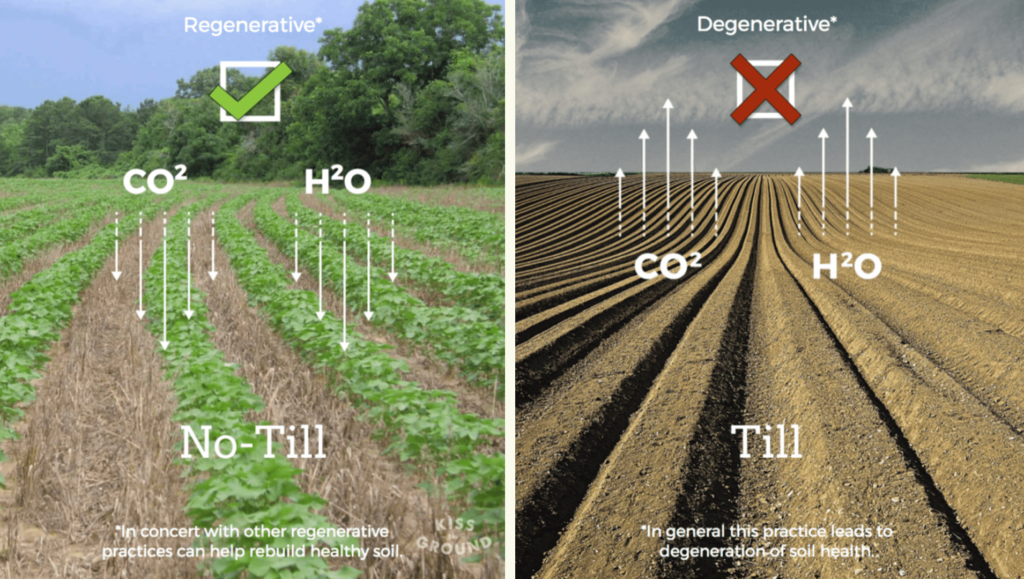
Unhealthy/dead soil can’t absorb and hold carbon, the ability to hold and infiltrate water decreases which leads to higher risks of drought and floods. The earth also loses its nutritional value and this leads to a loss in life and biodiversity in the soil which makes it hard to impossible to grow food.

When soil is healthy it absorbs carbon, helping to fight climate change. Healthy soil also holds and attracts water more easily. When the soil is healthy the biodiversity and nutrition it high, making it great for growing food.

This means that the way we grow things can either be part of the cause of creating climate change or be one of the most efficient ways to fight it.

Try to research if there are any farms in your country or near you that do regenerative farming and try to support them.

If you want to learn more about Regenerative Agriculture, you can join the nonprofit community Kiss the Ground.

I also recommend this post about Regenerative Agriculture by Holly Rose


Packaging

Plastic has gotten a terrible reputation when it comes to food packaging. And in many cases, the plastic packaging is unnecessary and non-recyclable but what a lot of people miss in this discussion is that the emission of the plastic packaging is tiny compared to the carbon footprint of what is IN the packaging.

Meaning that if the plastic packaging keeps the food fresh for longer and therefore minimizes the risk of food waste, it is saving the planet.

Now, there are of course other issues with plastic than the carbon footprint. It is made from fossil fuels and can’t biodegrade, which basically means it will never disappear completely once its been made. And even if the plastic is recyclable, it should rather be called downcycling, as it can only be recycled very few times, and each time it loses its quality until it is no longer usable.

So when it comes to products that won’t go bad quickly, getting it package free is the best option. But if it comes to fresh produce that quickly go bad – plastic doesn’t necessarily have to be that bad. If it does keep your food waste down, that outweighs the downside to the footprint of the packaging.


Sources:

https://ourworldindata.org/meat-production

https://www.drawdown.org/solutions/food/regenerative-agriculture

https://friendsoftheearth.uk/food-waste

https://www.who.int/news-room/fact-sheets/detail/antibiotic-resistance


This post was written by our blogger Evelina Utterdahl. You can read more about her here