How to reduce your carbon footprint: FOOD

how to reduce your cabron footprint

If you’ve already taken a carbon calculator test, you should know approximately what the emissions are for your diet. If not, here’s a list of different ways of eating and how big or small the carbon emissions are per person per year.


Diet

The charts above are very clear and it might not come as a surprise to many of you that a plant-based diet is more climate-friendly.

Now, I’m not going to push you all to become vegan. But I do hope you will try to eat fewer animal products and more plants. It’s better for your health, the animals and the planet.

Meat production has increased 4 times in the last 50 years. And in many countries, it is common to eat some sort of meat with every meal – breakfast, lunch, AND dinner.

UN experts say that to be able to eat meat in a sustainable way, we should rather aim for having meat for ONE meal a WEEK.

Cow and lamb meat are the worst when it comes to environmental impact and should be cut down dramatically to reduce your personal emissions.

But it’s so much bigger than just about the amount of CO2 it creates. It’s not even all about the greenhouse gases (cow farts release high quantities of methane gas, which is many times more potent than carbon dioxide).

The consumption of animal products is also the main cause of deforestation in the rainforest. One of the planet’s most vital “lungs”, which captures the CO2 to then release oxygen. So the animal agriculture both emits an immense amount of greenhouse gases and remove the natural machines that suck CO2 from the air. It’s a double negative that doesn’t become a positive.

Another part of animal agriculture that worries experts is the high usage of antibiotics, which increases the risk of bacterias building up a resistance to it.


Food Waste

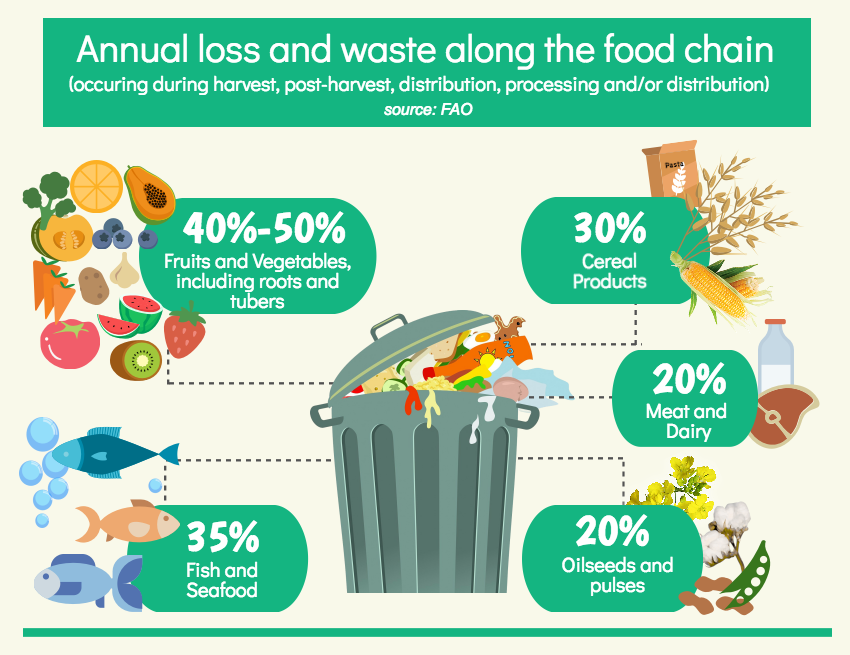
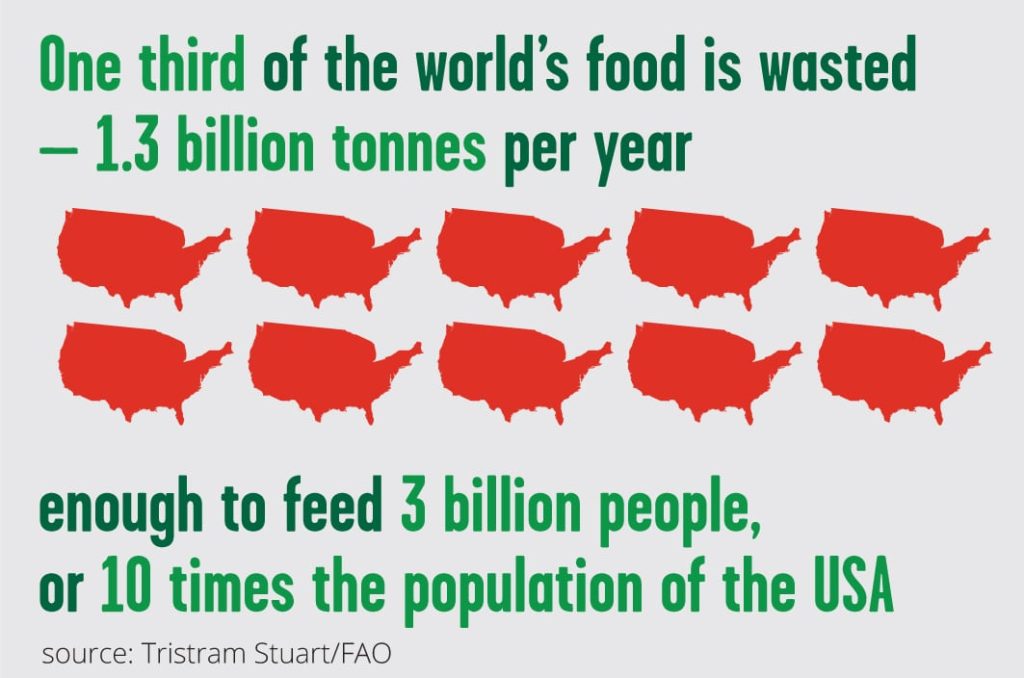
Did you know that 1/3 of all food that is produced for humans goes to waste? Tossing out edible food that took both resources like water, land use and creating greenhouse gases. Just imagine how much CO2 could be saved if we could stop food waste!

But of course, not all food waste happens in the home by us, the consumers. Edible food is first wasted when they don’t fit the aesthetic criteria (being too small, too big or too wonky). And then supermarkets sometimes order more food than they then accept, leaving literally tons of edible food going to waste before it even has a chance to be sold. And then as many of us are already aware of, many grocery stores throw away edible food to either make room for new items on the shelves. One broken egg makes the whole box being thrown away or when one of many vegetables or fruits in a pre-packaged bag is bad, they are all thrown away. Or perhaps it’s food related to holidays like Christmas or Easter that aren’t interesting for consumers after the holiday is over. It’s also common for products to be thrown away when it gets to close to “best before”-date even though the food will be good to eat long after that set date.

It’s calculated that in Sweden, the average worth of edible food thrown out each year per person is €400-600. Not only will minimizing your food waste save the planet, but it will save your wallet too. What would you do with an extra €400-600/year?


Location

Where your food was produced, packaged and shipped from also matters. Some food is flown in, others are shipped by cargo ships and others can be produced locally to where you live!

Try to opt for a diet with products that can and is being grown in the country where you live, or as close to it as possible.
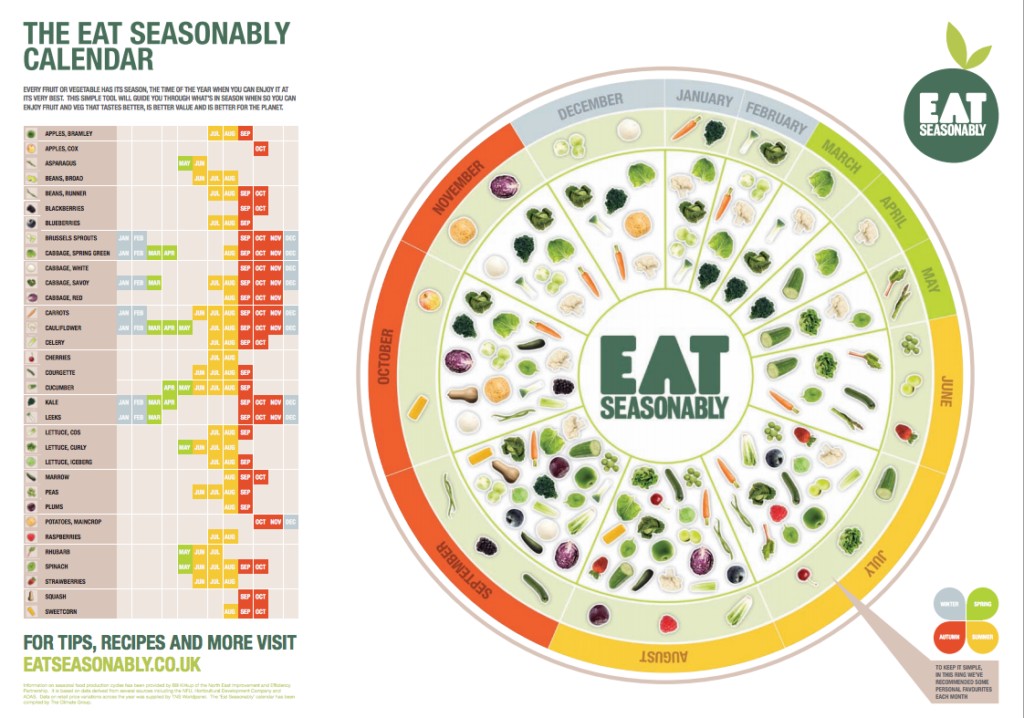

Seasonally

If you opt for food that is in season, it’s both cheaper and there’s no need to grow it in energy-intensive greenhouses. Of course, eating seasonally and locally is the best, but it’s also worth keeping in mind that not all food that is shipped from overseas is in season from where it was grown either. So try to learn, or print a guide that shows you what food is in season when to make it easier for you to plan your meals accordingly.


How it is grown

In the hunt of creating genetically perfect crops and crops that aren’t attacked by any type of insects, the soil was left out of consideration. Monocrops and pesticides stripped the vital soils of nutrition and biodiversity, leaving it unable to

As Project Drawdown puts it:

“Conventional wisdom has long held that the world cannot be fed without chemicals and synthetic fertilizers. Evidence points to a new wisdom: The world cannot be fed unless the soil is fed.”

And this is where Regenerative Agriculture comes in.

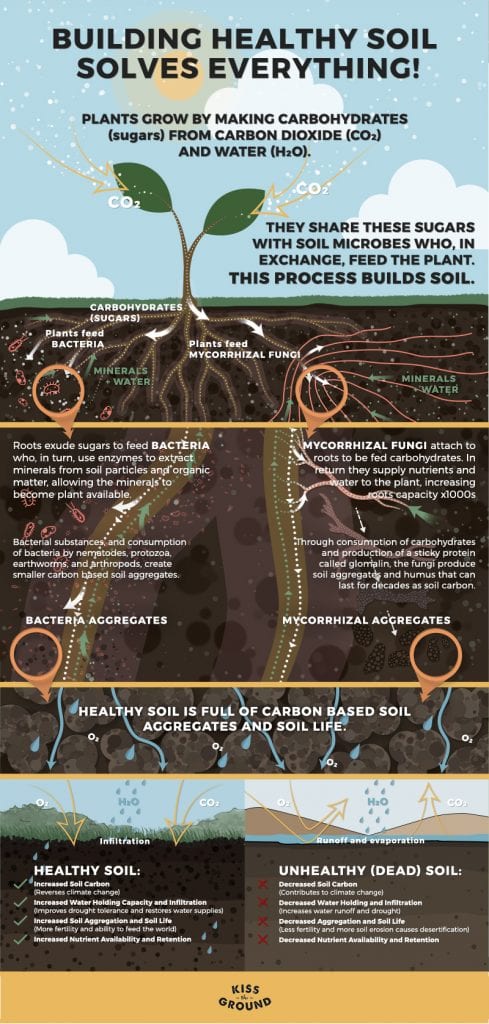
Unhealthy/dead soil can’t absorb and hold carbon, the ability to hold and infiltrate water decreases which leads to higher risks of drought and floods. The earth also loses its nutritional value and this leads to a loss in life and biodiversity in the soil which makes it hard to impossible to grow food.

When soil is healthy it absorbs carbon, helping to fight climate change. Healthy soil also holds and attracts water more easily. When the soil is healthy the biodiversity and nutrition it high, making it great for growing food.

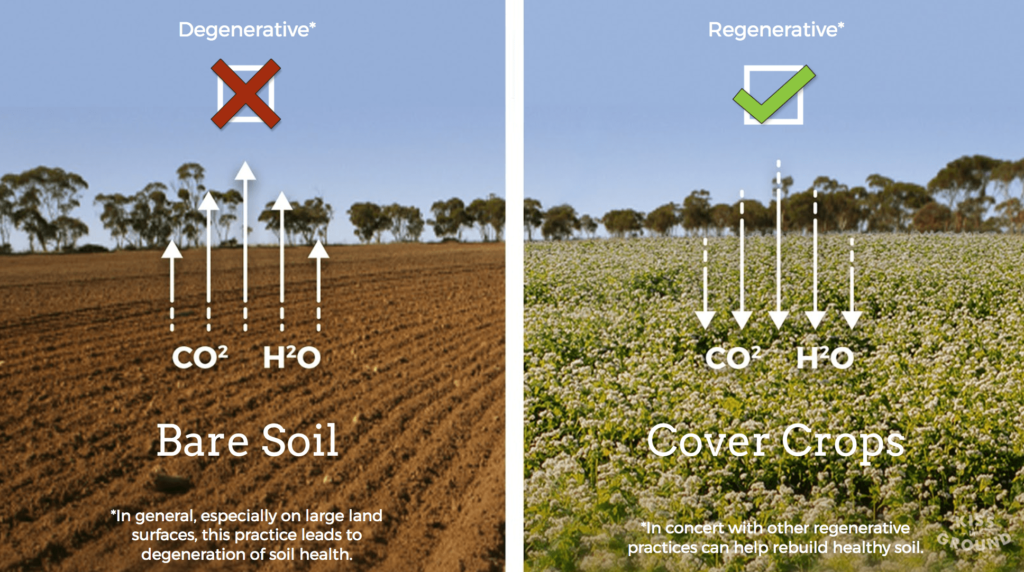
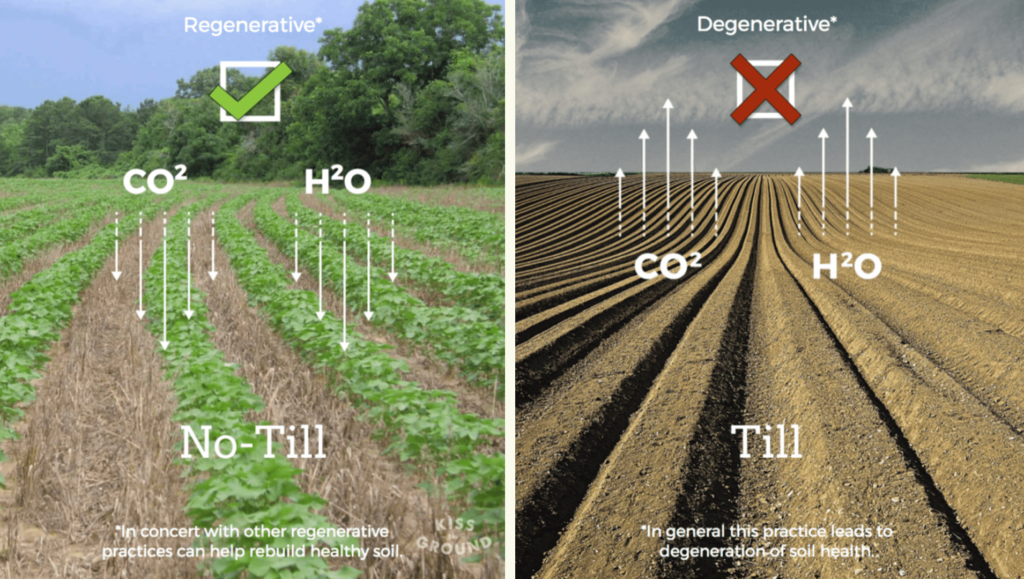
This means that the way we grow things can either be part of the cause of creating climate change or be one of the most efficient ways to fight it.

Try to research if there are any farms in your country or near you that do regenerative farming and try to support them.

If you want to learn more about Regenerative Agriculture, you can join the nonprofit community Kiss the Ground.

I also recommend this post about Regenerative Agriculture by Holly Rose


Packaging

Plastic has gotten a terrible reputation when it comes to food packaging. And in many cases, the plastic packaging is unnecessary and non-recyclable but what a lot of people miss in this discussion is that the emission of the plastic packaging is tiny compared to the carbon footprint of what is IN the packaging.

Meaning that if the plastic packaging keeps the food fresh for longer and therefore minimizes the risk of food waste, it is saving the planet.

Now, there are of course other issues with plastic than the carbon footprint. It is made from fossil fuels and can’t biodegrade, which basically means it will never disappear completely once its been made. And even if the plastic is recyclable, it should rather be called downcycling, as it can only be recycled very few times, and each time it loses its quality until it is no longer usable.

So when it comes to products that won’t go bad quickly, getting it package free is the best option. But if it comes to fresh produce that quickly go bad – plastic doesn’t necessarily have to be that bad. If it does keep your food waste down, that outweighs the downside to the footprint of the packaging.


Sources:

https://ourworldindata.org/meat-production

https://www.drawdown.org/solutions/food/regenerative-agriculture

https://friendsoftheearth.uk/food-waste

https://www.who.int/news-room/fact-sheets/detail/antibiotic-resistance


This post was written by our blogger Evelina Utterdahl. You can read more about her here

How to reduce your carbon footprint: Part 1

If you want to reduce your carbon footprint, you first need to know how big it is today. You need to know which parts of your footprint are the largest and how large they are in order to shrink it.

It can be extremely hard to know which changes you make that have the biggest impact. Knowing this ensures that you don’t spend most of your time and energy on something that will make a very small difference in relation to your emissions.

That’s why we are creating a series of blog posts showing you how to lower the different parts of an individual’s footprint, with the numbers and comparisons to show you where it might be worth making your changes, as we all have different lifestyles and our carbon footprints are all different.

Step 1 – calculate your carbon footprint

Here are some different tests you can try out. We suggest you try a few of them, as they are all different from each other and will together give a clearer picture of your ecological and carbon footprint.

https://www.carbonfootprint.com/calculator.aspx

https://www.footprintcalculator.org/

https://www.klimatkalkylatorn.se/ (SWE)

https://klimatkalkylatorn.viskogen.se/ (SWE)

https://www.klimatkontot.se/ (SWE)

https://footprint.wwf.org.uk/ (UK)

https://www.conservation.org/carbon-footprint-calculator#/ (US)

https://www.nature.org/en-us/get-involved/how-to-help/consider-your-impact/carbon-calculator/ (US)


In the upcoming parts, we will dig into the different categories below, providing examples of changes you can make and how much of a difference they can have.

Housing

Transport

Food

Consumption

Money/Savings

EARTH OVERSHOOT DAY

What does Earth Overshoot Day actually mean?

We’ve exceeded the allowed consumption of natural resources available for us in 2019. And this day occurs sooner every year. In 2018 Earth Overshoot Day took place on August the 1st, while this year it was 3 whole days earlier, on July 29th.

Source: Statista

This is the date for when the world had used up its resources, but many countries have their Overshoot Day sooner.

With the rate at which we are using our resources now, we would need 1,75 earths.

If everyone lives as the Americans, we would need 5 earths.

If we all lives as Australians or Swedes, we’d need 4 earths.

By using up our natural resources before they have time to regenerate, we are stealing resources from ourselves, and even more of the children who will grow up in a world where growing food is hard, where fresh drinking water is scarce and where biodiversity is at an alarming low. 

There is a campaign called #MoveTheDate started by Global Footprint Network, where we can all give tips or show how we work to Move The Date forward.


What can be done to lower our impact as a whole?

If we would cut CO2 emissions from fossil fuel burning in half, Earth Overshoot Day would occur 93 days later.

If we reduced global meat consumption by 50% and replaced these calories through a vegetarian diet, we would move Overshoot Day 15 days

If every other family in the world had one less child, we would move Overshoot Day 30 days by 2050.

If we reduce our Footprint from driving by 50% around the world and assume one-third of car miles are replaced by public transportation and the rest by biking and walking, Earth Overshoot Day would move back 11.5 days.


To know what you as an individual can do to lower your Footprint, it’s best to take one or a few tests to see in which areas there’s room for improvement. You can take a test to calculate your footprint here:

ECOLOGICAL FOOTPRINT CALCULATOR

Source: Overshootday.org


10 things you can do to lower your personal footprint

1. Carbon offset your lifestyle. You can do that here on GoClimate.org

2. Fly less, or much better – don’t fly at all. At least skip the leisure flight trips

3. Skip animal products. Beef is the worst, but the entire animal agriculture industry is one of the most harmful to our planet in more ways than just carbon emissions.

4. Shop less. We buy way too many things these days, which is made by using resources we now need to be extra careful with. And then the shipping across the world has a toll as well. Only buy what you need, and try to get it second hand.

You can get tips on how to shop less newly produced things here:

NOT BUYING NEW CLOTHES? HERE’S WHAT YOU CAN DO INSTEAD

5. Where does your money go? Most banks fund industries which most people would never knowingly support. Like the fossil fuel industry as well as weapon industry to name a couple. Look over your savings and try to move them to a bank that invest in a brighter and greener future.

6. Sell your car, if you have one. Is it possible for you to walk, cycle or take public transportation to work/school? Then save money and the planet by selling your car. You will then only drive when absolutely necessary and then you can borrow or rent a car. If you can’t get rid of your car, try to fill it when you use it. Try not to drive alone. Do you have any neighbors going the same way? Any colleagues who live one the way to work you could pick up?

7. Live smaller or with more people. A lot of energy goes into warming and/or cooling your home. The more people per square meter, the better. A bonus is that mental health often improves when living with others.

8. Waste less food. While avoiding plastic packaging might be getting more attention when coming to food when trying to live more sustainably – the food wasted has a way bigger impact than the actual packaging. Here’s a post where you can read on some things you can do with your food waste instead of throwing it away: http://www.earthwanderess.com/stop-food-waste/

9. Switch to green energy

10. Use your technology less. The internet requires an immense amount of energy so use it shorter and use it wisely. The tech industry is not sustainable at all, and you can expect some posts about that in more details during August.


This post was written by our blogger Evelina Utterdahl. You can read more about her here

The Carbon Footprint of Servers

We have done some research about the carbon footprint of running cloud, data center and on-premise servers.

Our goal has been to find a way to estimate the carbon footprint from the servers we need to calculate emissions for in our business carbon footprint calculator. We wanted to find a good approximation of the emissions without forcing the business to enter everything about the server-model and kWh-consumption they use in our calculator.

This is an attempt to summarize our findings.

PS. Are you looking to lower your carbon footprint and contribute to a more sustainable world? We would love to help! Take responsibility for the carbon footprint of your lifestyle now!

We quickly realized that just requiring the number of servers running is a too rough measurement, often resulting in estimations 5-10x lower or higher then a precise calculation. So we needed to require more parameters from our business users to not be too off in our approximation.

After some experimenting and reading we found that there are two factors that both are fairly easy to find out and also make a big impact on the carbon footprint of servers, if the electricity used is green or not and if the servers are in the cloud or not.

Therefor we divide our calculations of the carbon footprint for servers into four categories. More categories could easily be constructed to achieve more precise estimations, but as stated earlier, our goal was also to make this an as easy as possible thing to find out for the business calculating the footprints.

The four categories we ended up with are:

  1. Cloud server using 100% green electricity
  2. Cloud server using non-green electricity
  3. On premise or data center-server using 100% green electricity
  4. On premise or data center-server using non-green electricity

To find out which category to use, you need to know if the electricity your servers are using is 100% green (or if the electricity not green is being offset in a credible way) and if your servers can be considered running in a cloud.


How do I know if the electricity our servers are using is 100% green?

With green electricity we mean fossil free electricity, so both renewable energy sources and nuclear energy are considered green – and are in our calculations considered having a zero climate impact. This is not 100% true since both renewable sources and nuclear sources have a carbon footprint from construction and maintenance, but the climate impact are negligible in comparison with electricity from fossil sources.

Depending on where your servers are located, there are different ways of finding out if the electricity your servers use is green:

  • On premise-server – check your electricity contract or contact your electricity-provider
  • Data center-server – check your contract or contact your provider
  • Cloud server – this is a bit more tricky. But if you want the short answer per provider:
  • Google Cloud – 100% green
  • Microsoft Azure – 100% green
  • Amazon AWS – Non green electricity for all locations except US West (Oregon), Europe (Frankfurt), Europe (Ireland), GovCloud (US-West), Canada (Central). More locations might appear in the future here: https://aws.amazon.com/about-aws/sustainability/
  • Oracle – Non-green except for in the UK
  • IBM – Non-green
  • Alibaba – Non-green

Source and more thorough examination of the cloud providers can be found here: The State of Data Center Energy Use in 2018

How do I know if my servers are in the cloud?

This might sound like an easy question, but there are many local providers that have smaller cloud-like solutions that might be as energy effective and utilize servers as good as the larger ones.

So the question you should ask yourself here – if you are unsure if your servers can be considered being in the cloud or not – is if your provider can utilize servers about as effective as the larger providers and if they can have the same energy efficiency as the larger ones.

The difference between the carbon footprint of servers running in large cloud providers and not can be big. According to the studies we have found on this:

We have decided to apply a simple factor of 0.5 for the energy consumption and server utilization of servers in the cloud. Amazon AWS claims a reduction of 84% in the amount of power required, but since we don’t have data for other providers we prefer to be bit more conservative here.

The energy consumption from manufacturing and use

In our carbon footprint business calculator we have chosen to use data from a standard 2019 R640 Dell server. This is deemed as a high end but not unusual server being bought 2019. An exact server model would give more precise data here, but we decided that it was not reasonable to expect people using our business calculator to know the exact name of the servers if the have been bought by the business, and in the cloud it’s close to impossible to know exactly what hardware model your server is run on anyway.

The data sheet for the server we chose can be found here: https://i.dell.com/sites/csdocuments/CorpComm_Docs/en/carbon-footprint-poweredge-r640.pdf

The server is consuming 1760.3 kWh / year and has a manufacturing climate impact of 320 kg CO2e/year, assuming a four-year life span.

If you are doing a calculation of your own and you know exactly what kind of server you or your provider uses, you should use those numbers instead.

The Four Carbon Footprint categories

We have used the Nordic Residual Energy mix as the factor for CO2e emissions per kWh. The factor is  0,37199 CO2e / kWh (updated 2022). The reason for us using this is that most business using our calculator are expected to be in the Nordics.

So, if we use these number and assumptions from above:

  • Emissions from production of servers for use on premise: 320 kg CO2e/year
  • Emissions from production of servers for use in cloud (since 50% is manufactured for use in cloud): 160 kg CO2e/year
  • Emissions from green power consumption: 0 kg CO2e/year
  • Emissions from non-green consumption for premise power or self-managed servers: 1760,3 kWh / year * 0,37199 CO2e / kWh = 655 kg CO2e
  • From non-green cloud power consumption: 1760.3 kWh / year * 0,37199 CO2e / kWh * 0,5 = 327 kg CO2e

This results in these factors four our four categories:

  1. Cloud server using 100% green electricity: 160 kg CO2e / year and server
  2. Cloud server using non-green electricity: 487 kg CO2e / year and server
  3. On premise or data center-server using 100% green electricity: 320 kg CO2e / year and server
  4. On premise or data center-server using non-green electricity: 975 kg CO2e / year and server

Please comment to this post if you have any questions or comments!

If you want help with doing a GHG-emissions calculation for your business, feel free to use our carbon footprint business calculator or contact us at [email protected] – and if you want to start living a climate neutral life, join us today!